Dashboard
The following dashboard gives you an overview of the Memory usage on the cluster.
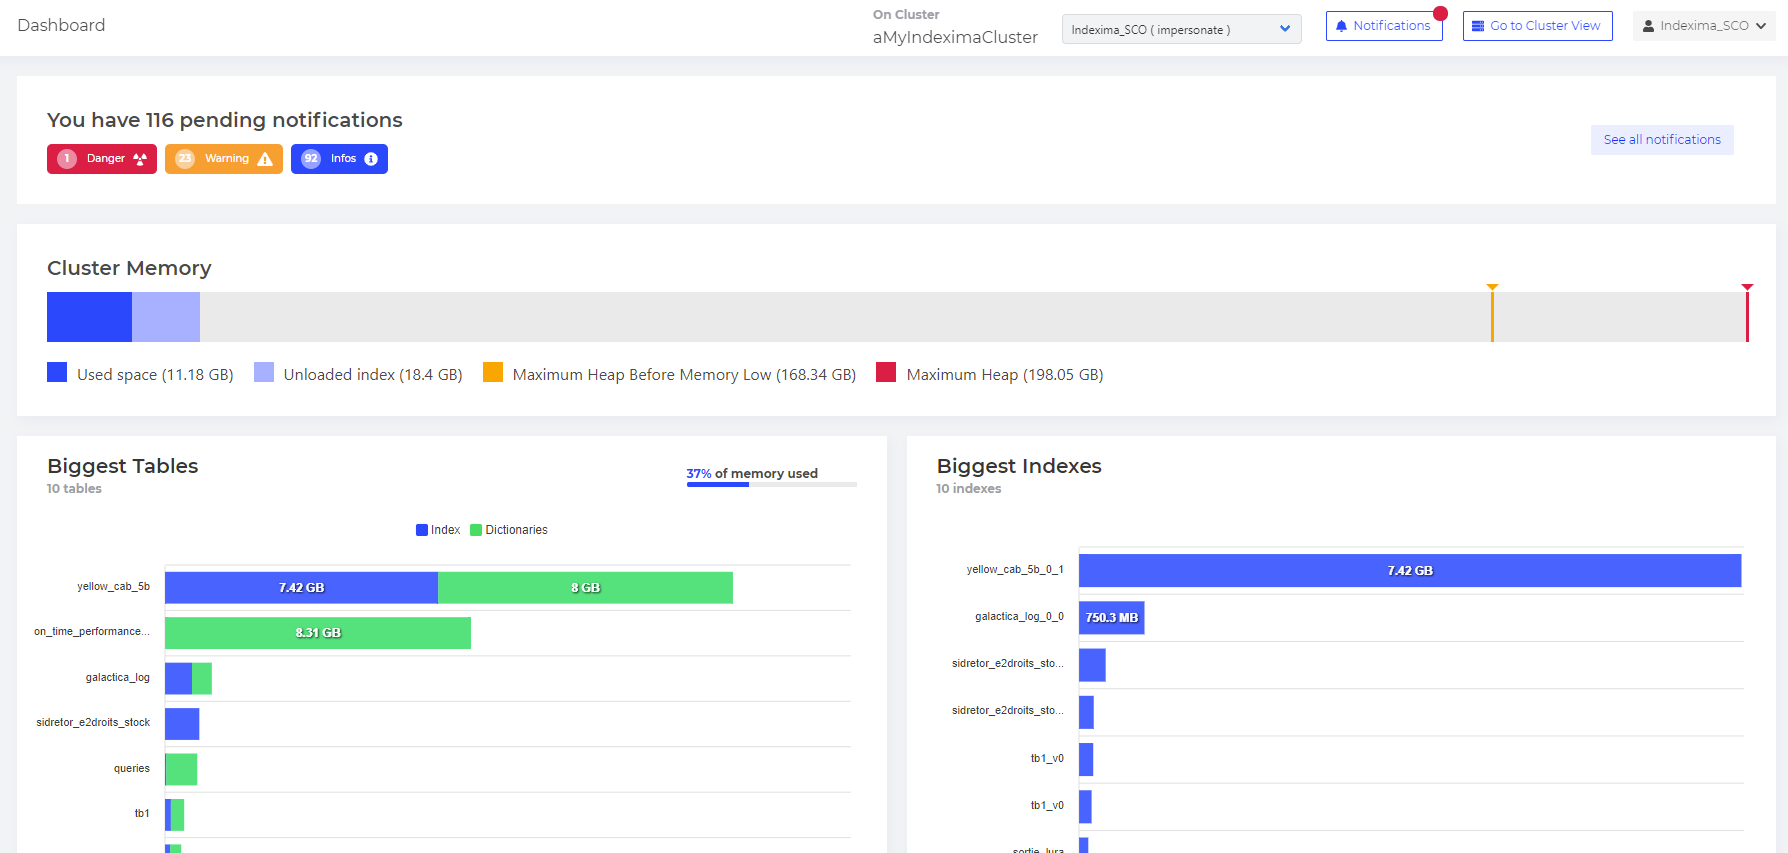
The Dashboard is divided into 4 sections described below:
Notifications
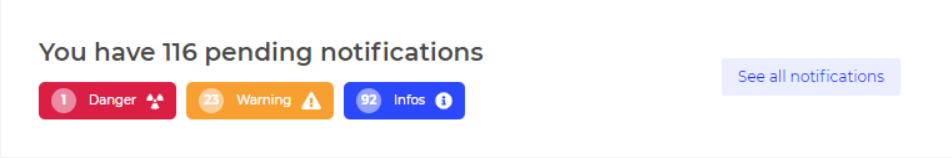
3 types of Notifications are displayed:
- Danger
- Warning
- Infos
'See All notifications' allows you to view all notifications.
Overall Cluster Memory (usage)
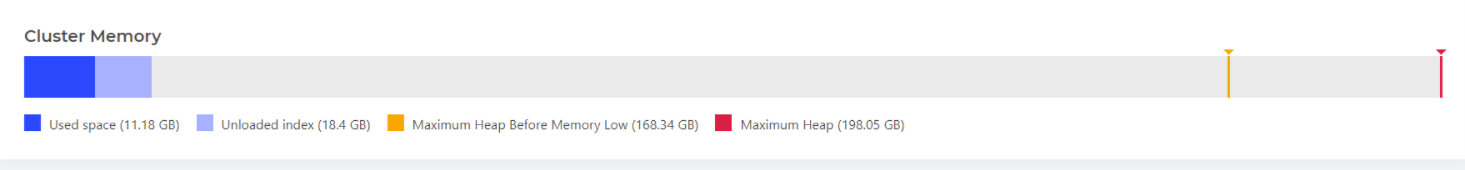
- Used space: Memory used (Indexes & Dictionaries) of loaded indexes.
- Unloaded index: Memory used (Indexes & Dictionaries) of unloaded indexes.
- Maximum Heap before Memory low: Memory allocated for the indexima service - minus a buffer memory space.
- Maximum Heap: Memory allocated for the indexima service.
Recommendation
Used Space + Unloaded Index should represent less than half of the Maximum Heap before Memory is low.
The other half is dedicated to SELECT or LOAD queries memory consumption.
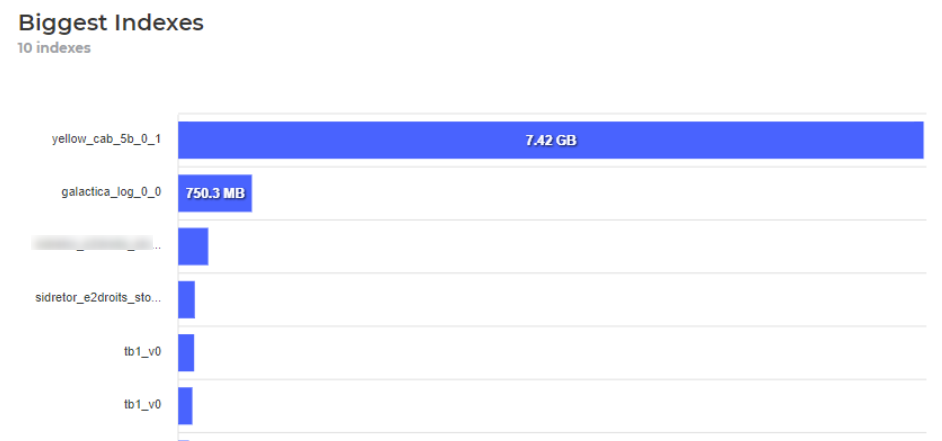
10 Biggest Tables & Indexes
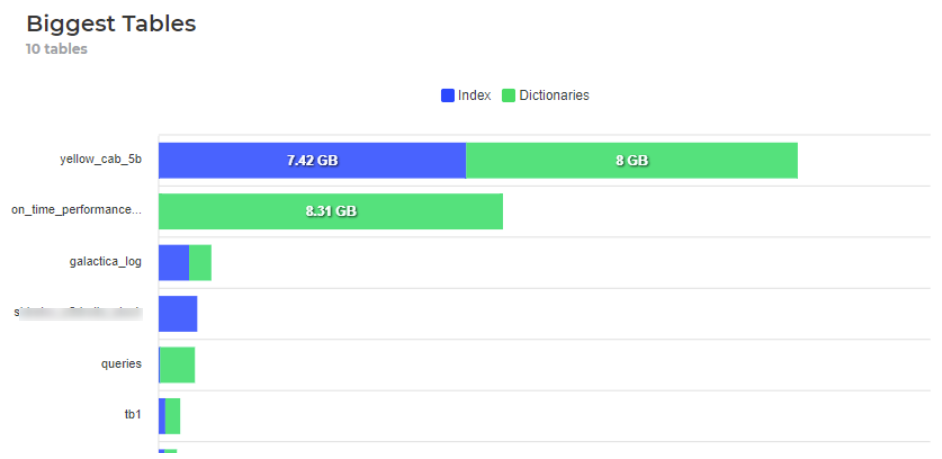
As you can see, Memory usage is split into Index and Dictionaries size.
10 Biggest Indexes